Data & Analytics
One trusted view of how the organisation is performing.
Dashboards, reporting and data pipelines.
Overview
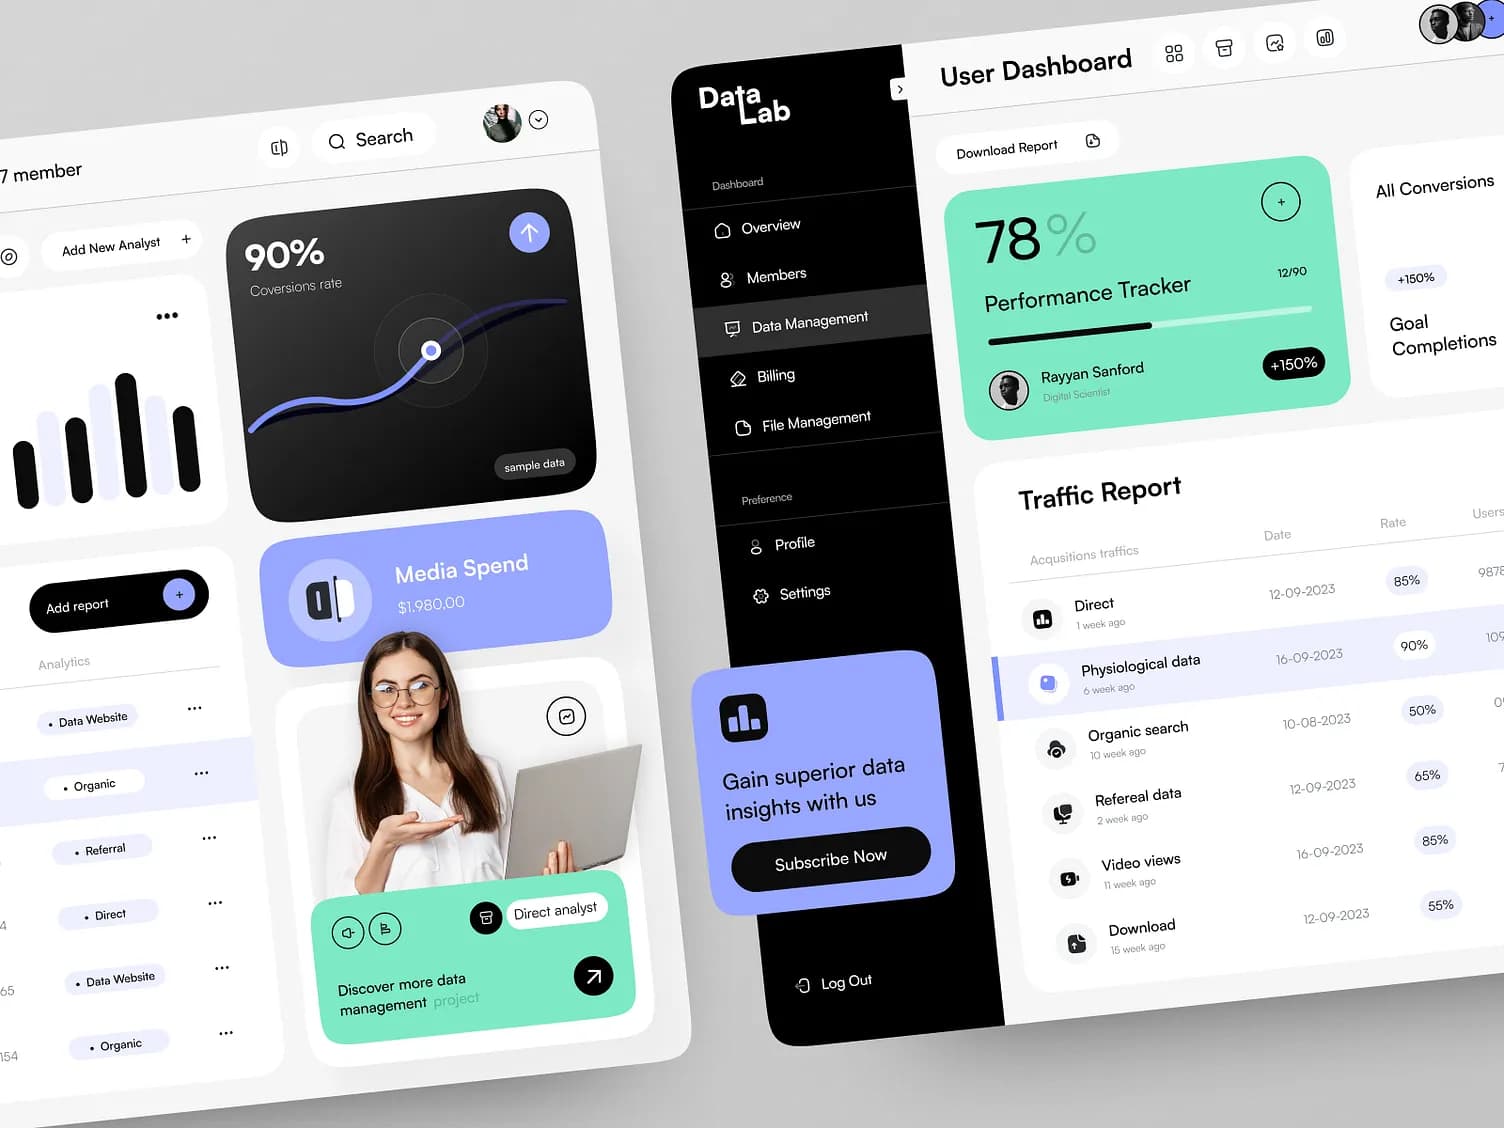
Most organisations already have the data they need, spread across systems, spreadsheets and phones. We bring it together into dashboards and reports that management can trust and act on.
See it working
What this looks like in practice.

What you get
Scoped to your needs. Every item is something we design, build or configure for you.
- 01Executive and branch dashboards
- 02Automated daily, weekly and monthly reports
- 03Data pipelines from your existing systems
- 04Data cleaning and single source of truth
- 05KPI definition workshops
- 06Exports for regulators, boards and donors
How we approach it
The details that matter.
- 01
Agree the numbers first
We define each metric with your team before building, so every dashboard answers a real question and everyone reads it the same way.
- 02
Automated, not assembled
Reports refresh themselves from the source systems, ending the end-of-month rush to compile spreadsheets.
- 03
Readable on any screen
Dashboards are designed for the boardroom screen and the manager’s phone alike.
Questions
Data & Analytics: questions clients ask.
Can you connect data from several systems?
Yes. We build pipelines that pull from databases, APIs and spreadsheets into one reporting layer.
Do we need to buy a BI licence?
Not always. We can build dashboards into your own system or use a BI tool you already license.
Can reports be emailed automatically?
Yes. Scheduled reports can be delivered by email or WhatsApp to the people who need them.
Let’s build what’s next.
Tell us what you need. A person replies, then sends a written proposal with a fixed quotation.